An economic model for Data Gravity
TL;DR
We can model data gravity by looking at the respective storage and network costs for different scenarios where workload and associated data might be placed in one or more clouds. As network egress charges are relatively high, this makes the effect of data gravity substantial – pushing workloads and their data to be co-resident on the same cloud.
Background
Dave McCrory first proposed the idea of Data Gravity in his 2010 blog post ‘Data Gravity – in the Clouds‘:
Consider Data as if it were a Planet or other object with sufficient mass. As Data accumulates (builds mass) there is a greater likelihood that additional Services and Applications will be attracted to this data
He finishes the post with ‘There is a formula in this somewhere’. This post will attempt to bring out that formula.
More recently
The 451 Group’s cloud economist Owen Rogers wrote a report almost a year ago titled ‘The cloud bandwidth tax punishes those focused on the short term’ (paywalled), where he explored the interactions between storage cost and bandwidth cost.
As I noted in The great bandwidth swindle cloud providers are using egress charges as an economic moat around their services. It makes data gravity true.
Owen’s report contains a simple model charting access frequency against storage period to determine a heat map of bandwidth contribution to total cost, and it’s a very hot map, with much of the surface area past 50%.
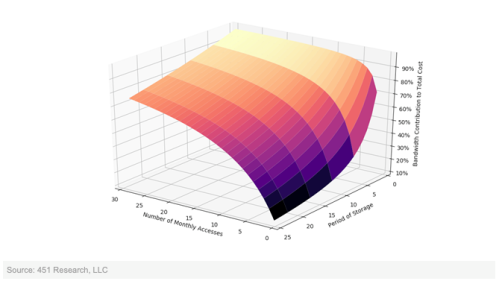
With thanks to Owen Rogers at The 451 Group for allowing me to use his chart
The emerging message is simple – once your data is in a cloud storage is very cheap relative to the cost of getting the data back out.
The corollary is also alluringly simple – data gravity is real, so you should put all of your data (and associated workload) into the same cloud provider.
Variables
We typically refer to compute, storage, and network when talking about systems, so let’s use the variables c, s, and n respectively.
Duration
c is usually billed by the hour, though the resolution on usage might be down to the second for IaaS or by a number of invocations for FaaS (with CaaS and PaaS dropping somewhere in between on the spectrum).
s is usually billed by the GB/month
n is usually billed by the GB
Most clouds present bills on a monthly basis, so it makes sense to evaluate over that duration, and allows us to build realistic scenarios of how c, s & n combine to a total bill (b).
The basic equation
b = c + s + n
Simple enough, the monthly bill is the sum of compute, storage and network egress costs, which is pretty uninteresting.
Two clouds
This is where it gets interesting. It could be two regions in the same cloud provider, two different cloud providers, or the oft discussed hybrid of a public cloud and a private cloud. The gross mechanics are the same, but the scaling factors may vary a little.
b = c1 + s1 + n1 + c2 + s2 + n2
Again, this seems simple enough – the monthly bill is just the sum of compute, storage and network egress used across the two clouds.
Base case – independent applications
Where the apps deployed into cloud 1 and cloud 2 have no interaction there’s really nothing to consider in terms of the equation above. We can freely pick the clouds for reasons beside data gravity.
Case 1 – monthly data copy
Scenario – the transactional app in cloud1 generates 100GB of data each month that needs to be copied to the reporting app in cloud2
Assumption 1 – compute costs are roughly equivalent in cloud1 and cloud2, so we’ll ignore c1 and c2 for the time being, though this will give food for thought on what the delta between c1 and c2 needs to be to make it worth moving the data.
Assumption 2 – the output from the reporting app is negligible so we don’t run up egress charges on cloud2
Assumption 3 – once data is transferred to the reporting app it can be aged out of the transactional app’s environment, but the data is allowed to accumulate in the reporting app, so the storage cost goes up month by month.
Taking a look over a year:
b1 = $2.5 + $9 + $2.5 +0
b2 = $2.5 + $9 + $5 +0
b3 = $2.5 + $9 + $7.5 +0
b4 = $2.5 + $9 + $10 +0
b5 = $2.5 + $9 + $12.5 +0
b6 = $2.5 + $9 + $15 +0
b7 = $2.5 + $9 + $17.5 +0
b8 = $2.5 + $9 + $20 +0
b9 = $2.5 + $9 + $22.5 +0
b10 =$ 2.5 + $9 + $25 +0
b11 = $2.5 + $9 + $27.5 +0
b12 = $2.5 + $9 + $30 +0
by = 12 * $2.5 + 12 * $9 + 12 * ((12 + 1) / 2) * $2.5 = $30 + $180 + $195 = $405
In this case the total storage cost is $225 and the total network cost is $180, so network is 44% of the total.
Refactoring the app so that both transactional and reporting elements are in the (same region of the) same cloud would save the $180 network charges and save that 44% – data gravity at work.
Case 2 – daily data copy (low data retention)
Scenario – the modelling app in cloud1 generates 100GB of data each day that needs to be copied to the reporting app in cloud2
Assumptions 1 & 2 hold the same as above
Assumption 3 – the reporting app updates a rolling underlying data set
b = $2.5 + $270 + $2.5 + 0
by = 12 * $2.5 + 12 * $270 + 12 * $2.5 = $30 + $3240 + $30 = $3300
In this case the total storage cost is $60 and the total network cost is $3240, so network is 98% of the total. The Data Gravity is strong here.
Case 3 – daily data copy (high data retention)
Scenario – the modelling app in cloud1 generates 100GB of data each day that needs to be copied to the reporting app in cloud2
Assumptions 1 & 2 hold the same as above
Assumption 3 – the reporting app keeps all data sent from the modelling app
b1 = $2.5 + $270 + $37.5 + 0
…
b12 = $2.5 + $270 + $862.5 + 0
by = 12 * $2.5 + 12 * $270 + 12 * 30 * (12 / 2) * $2.5 = $30 + $3240 + $5400 = $8670
In this case the total storage cost is $5430 and the total network cost is $3240, so network is down to 37% of the total, which is still pretty strong data gravity.
Conclusion
We can build an economic model for data gravity, and it seems to be sufficiently non trivial to lead to billing driven architecture, at least for a handful of contrived use cases. Your mileage may vary for real world uses cases, but they’re worth modelling out (and I’d love to hear the high level findings people have in comments below).
Filed under: cloud | 2 Comments
Tags: cloud, data, economics, equation, formula, gravity
Subscribe
Recent Comments
Monki Gras 2026: Wra… on Monki Gras 2026 Chris Swan on Milo cancer diary part 20… Chris Swan on Milo cancer diary part 20… Chris Swan on USB C Charger Reviews Peter on USB C Charger Reviews  Pinboard.in bookmarks
- Minimal SSH primer
- The Flat Curve Society
- Your Container Is Not a Sandbox: The State of MicroVM Isolation in 2026
- sideprojectslab/PD-64: A USB-PD switching PSU replacement for the C64 that also delivers galvanically insulated AC voltage
- Deepfakes are everywhere. The godfather of digital forensics is fighting back
- Tempest vs Tempest | The Making and Remaking of Atari's Iconic Video Game
- RISE RISC-V Runners: free, native RISC-V CI on GitHub
- The web is bearable with RSS
- House of Lords Digital & Communications Committee - AI, copyright & the creative industries
- CI/CD for Context in Agentic Coding: Same Pipeline, Different Rules


2 Responses to “An economic model for Data Gravity”